

Recent Posts
The Integrative Model of Adjustment to Continuous Challenges (IMACC): understanding and supporting biopsychosocial adjustment
By Lis Dreijer Hammond, Aalborg University (DK), Christian Karlsen Hansen & Martin Lehmkuhl Kristensen, Rehabilitation Centre for Refugees, North Jutland Regional Health Services (DK) and Chalotte Glintborg, Aalborg University (DK) When illness or major negative...
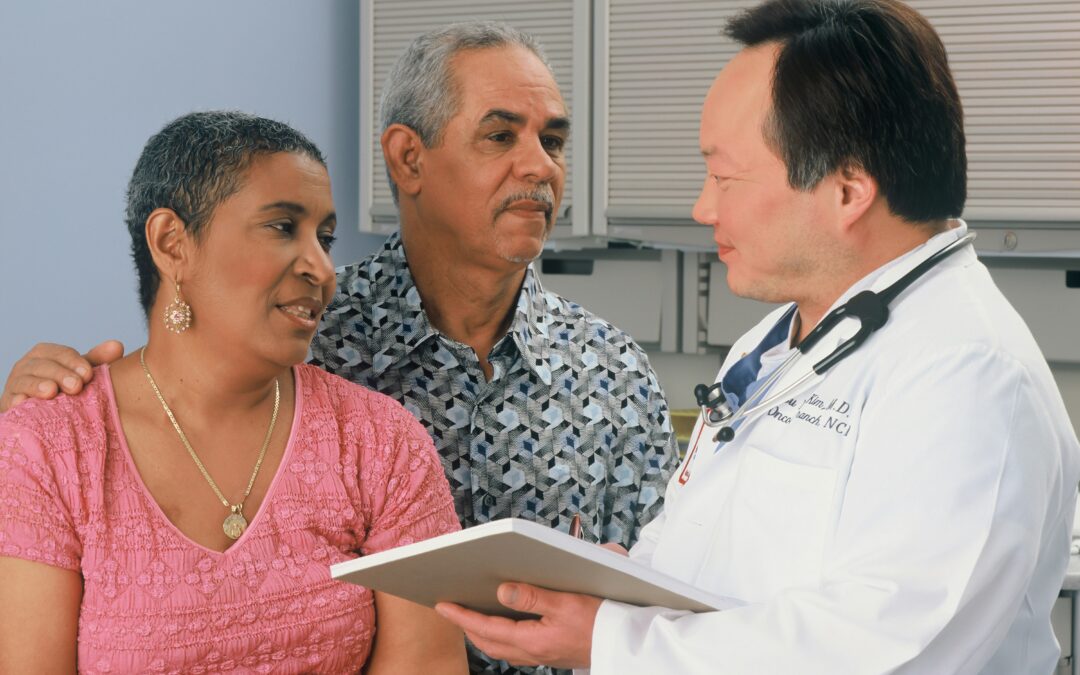
Helping caregivers when patients leave hospital: Practical lessons from co-production
By Kathryn McEwan, Northumbria University, UK Sarah helped her father pack his belongings; relief mixed with rising anxiety. After five days in hospital following his stroke, he was being discharged. A nurse had briefly mentioned medication changes and follow-up...
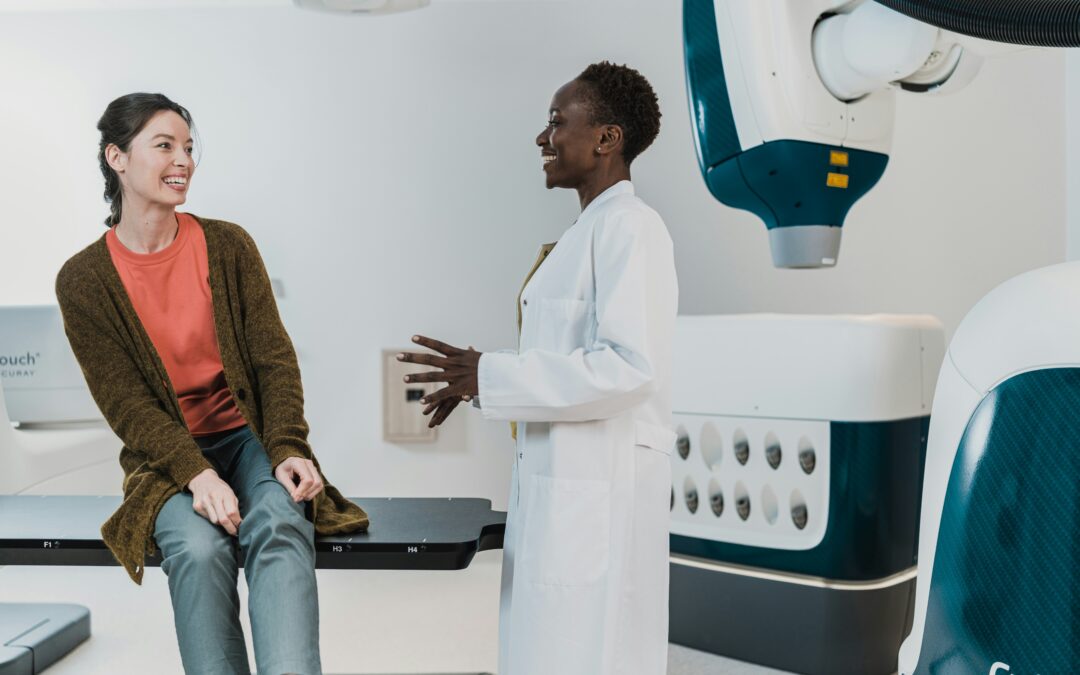
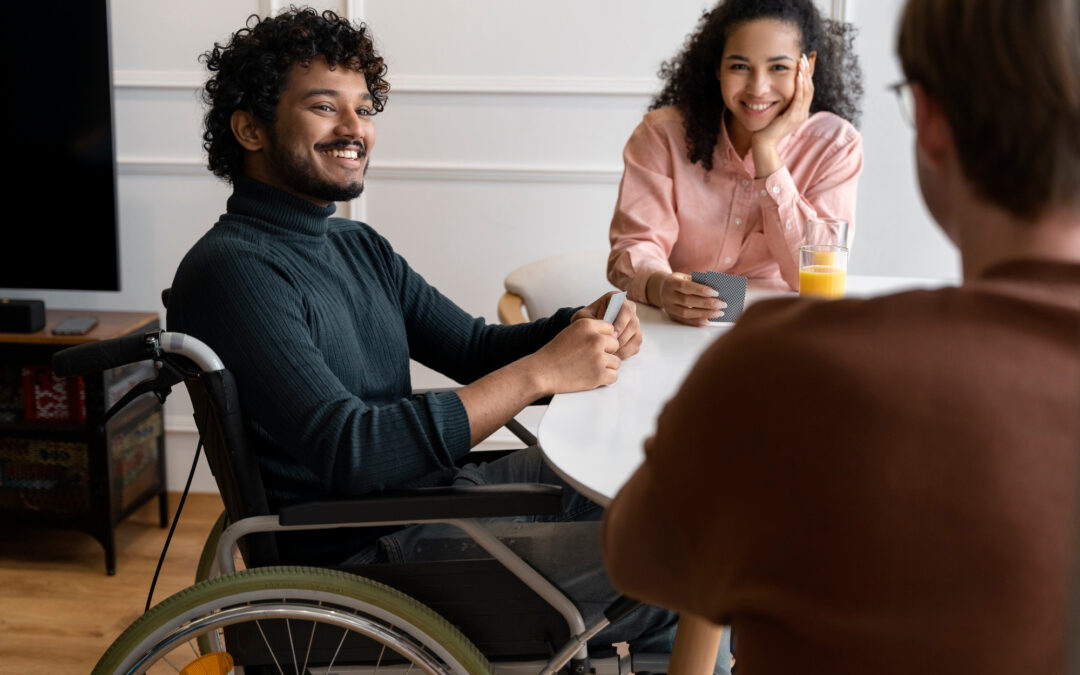
Mind the Gap: Embedding Equity in Everyday Practice
By Amanda O’Connor, Claire Blewitt and Helen Skouteris, Monash University, Melbourne, Australia. Health equity means that everyone has a fair and just opportunity to achieve good health, regardless of socioeconomic position, ethnicity, gender, or other social...
Download Our Free Practical Health Psychology E‑Book
Get research-backed answers to real-world questions about motivation, goal-setting, and behavior change—all in one free, practical e‑book.