
By Marie Johnston and Derek Johnston, University of Aberdeen, Scotland
Practitioners frequently want the answer to a problem which concerns one person, one health care team, one hospital or one region etc. For example, it may be important to know how often an obese man snacks, when and where he snacks and if stress makes it worse. Or you may wish to find out how often members of the healthcare team omit hand hygiene, if it is worse when they are under-staffed and if ward adverts improve it. Or you may be investigating sources of clinical errors to check if they are more common on some wards or for some grades of staff. Or, at a policy level, it might be valuable to investigate whether a new regulation, such as a smoking ban in public places has affected smoking rates.
You might try to answer these questions by asking people what they think or remember but it would be better to ask or observe at the critical times and places to avoid problems of bias and forgetting. Recent technological advances such as digital monitoring using smartphones make it easier to track what is going on in real time and an n-of-1 study might allow you to answer your question.
N-of-1 studies are possible when the problem can be assessed repeatedly to look at change over time. Then one can describe the problem and examine whether it is better or worse under some conditions. Or one may introduce a new intervention or treatment and assess whether it is having the proposed effect.
The simplest evaluation of the data collected is the observation of trends on a graph as in the illustrations below. This is an essential step in any n-of-1 analysis and can be sufficient. Additionally, there are methods of statistical analyses for n-of-1 studies. More complex methods continue to be developed (e.g., methods for assessing dynamic change ).
Using n-of-1 studies to assess the problem
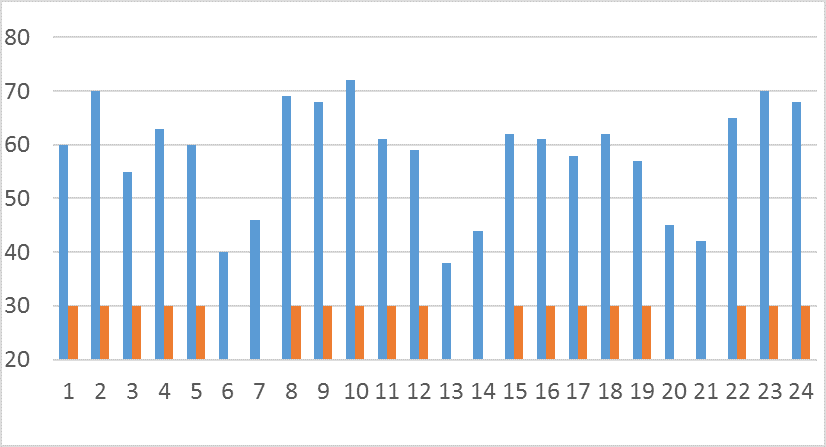
A study may be undertaken to assess the severity or frequency or pattern of a problem over time. In Figure 1, anxiety ratings vary over time but it is possible to detect a pattern. When attendance at work is also recorded, the pattern observed shows a difference between weekends and the five work days and might indicate that the person is anxious at work but not at home. Such information could prove helpful in choosing the optimal treatment method for the patient. For example tracking mood and time of day in a dying woman showed patterns that were used to ameliorate depressed mood.
The information collected in these n-of-1 studies may go beyond describing the problem and help to explain what is observed. In some cases the practitioner may have a theory about what influences the observed problem and it may be possible to test how well the theory explains observed phenomena. In the case of the dying woman, tracking her thoughts and activities confirmed the theory that her mood was influenced by thoughts and the critical thoughts were associated with early morning activities
Figure 1: Using N-of-1 study to describe a problem: shows anxiety ratings in blue and work days in red over 24 days
Using n-of-1 studies to assess whether an event or occurrence has improved or worsened the problem
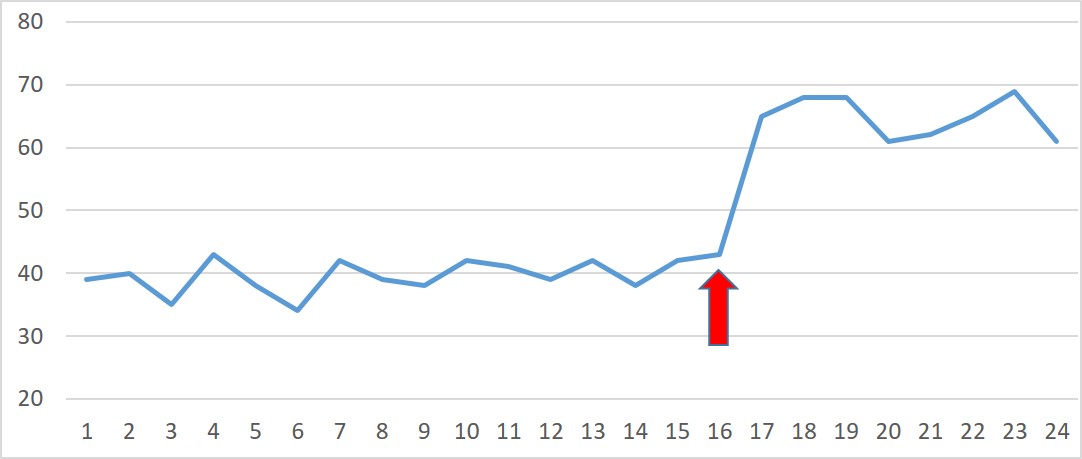
Problems may be improved or worsened by the occurrence of naturally occurring or planned events such as family death or wedding, a media broadcast of health information, a factory closing, or even weather. In the hypothetical illustration in figure 2, consultations about a medical condition (such as ‘flu) were much increased in the week following a TV broadcast on the topic suggesting that this increase was not due to an impending epidemic and also that in future, health services might anticipate such increases in consultations when medical conditions make news headlines. An n-of-1 analysis of English hospital episode statistics showed the effect of a sporting event – there was an increase in hospital admissions for cardiac events associated with an important football match during the 1998 world cup.
Figure 2: Using n-of-1 studies to assess the effect of an event: there are approximately 40 consultations per day about flu until the TV broadcast (shown by the blue arrow) appears to cause an increase in consultation rates
Using n-of-1 studies to assess whether an intervention or treatment is having the desired effect
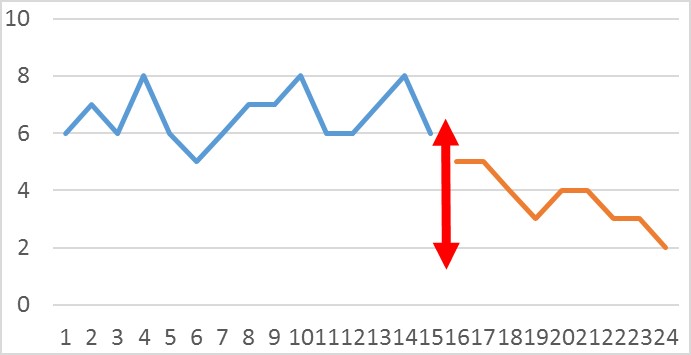
N-of-1 methods may be used in the development of new interventions, including clinical and policy interventions. In the hypothetical example in figure 3, an obese patient is snacking approximately 7 times per day; following the intervention indicated by the red arrow (possibly self-monitoring of snacking), snacking quickly reduces to 2 times per day.
Similar methods can be used to study a nation’s smoking and assess the impact of policy changes such as the smoking ban in public places, e.g., how national policy affects smoking.
A good example of the practical use of N-of-1 methods to evaluate the effect of an intervention was reported by practitioners in a hospital district. They assessed the problem of delay in reporting adverse events for the period from 2001 to 2006 and found that, while delay varied, it was problematic for their patient safety programme and did not show signs of improvement over time. In 2007 and 2008 a program to recognise good performance was introduced which led to reduction in the delays for subsequent years and shows how such recognition improved timely reporting.
Figure 3: Using n-of-1 studies to assess the effect of intervention:the first 15 days shows the frequency of snacking self-monitoring starting at day 16 (shown by the red arrow) results in reduced snacking
Challenges
Data collection can be challenging. Frequent repeated measurements can be burdensome and may result in missing data. The current rapid developments of affordable digital and mobile technologies including smartphones, wearables and sensors make data collection easier and more reliable.
Practical Recommendations
- Use an n-of-1 study in practical situations
- to describe and assess a problem,
- to assess the effects of an intervention or an event.
- Assess a problem or something important that can be assessed repeatedly over time.
- Interpret the data using descriptive methods such as graphs or using statistical methods.
- Free smartphone apps for collecting self-report data are available.